An Idea Mapping Success Blogs Weblog
Dynamic Dashboard Drastically Improves Productivity – Idea Map #71 Featured in today’s January Mindjet Newsletter
16Jan2008 Filed under: Idea Mapping Example, Idea Maps for Meetings, Mind Mapping Examples, Productivity, Project Management Author: Jamie Nast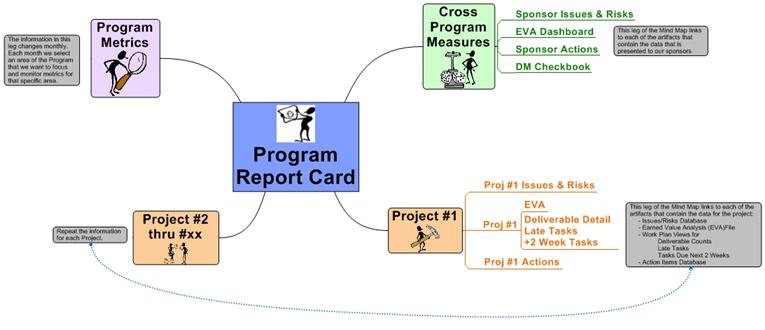 Overview
In the Spring of 2007, I introduced Denny Sikkila (Mindjet Central Region Manager) to one of my clients at a large automotive company here in Michigan. Denny helped her build a MindManager prototype to develop a Program Dashboard that has transformed their weekly status meetings. Not only has it saved them time in preparing for meetings, it has also resulted in more effective meetings.
Before
Every week a group of 35 IT project leaders would gather to review the status of the most major IT projects happening within the organization. In order to prepare for the meeting, a team of 4 people had to build a document approximately 85 pages in length. Each week they:
- Required that all data was updated with actuals: project work plans, financials, issues, risks, scope control, and metrics reports
- Cut the data out of each source and pasted the data (as a picture) into the document
- Printed the 85-page status document
Because of the time-consuming task of cutting and pasting, the document was out-of-date by the time it was printed. (The weekly cut and paste took 2 days to execute.) The 85-page document was difficult to review and required the 35+ people to set aside two hours each week to report statuses. The team spent more time shuffling back and forth through the 85 pages and debating why the data was out-of-date, than they spent understanding the status and reviewing and resolving issues.
A mandated reduction in their staff forced them to become more efficient. This led to the idea of creating a dashboard and eliminating the cut and paste process. MindManager was the perfect tool. It allowed them to quickly and easily create a dashboard that linked directly to all the data.
The New Process
Today there is only one requirement in this process. The meeting participants need to make sure their data is up-to-date before it’s their turn to discuss any status. This Mindjet-driven dashboard links to over 50 files and 10 weblinks.
All the cutting, pasting, and printing have been eliminated — which saves approximately 20 hours per week. They’ve also reduced status meetings from 2 hours to 1. But more importantly, the meetings have reach a higher level of maturity. All information is reviewed electronically (via a projector). The team members can sit in a meeting and update the data real time. For example, if an issue needs to be reworded, it’s done right there and then. Today the focus of the meeting is on analyzing the data instead of making excuses and debating out-of-date information. With the click of the mouse, tons of data can be accessed quickly and easily. Instead of reviewing a hard copy picture, files are accessed in real time. This allows for the ability to drill down to the specific tasks, hours, predecessors, etc. They can now make informed decisions right on the spot, because they have access to all the correct data. MindManager has transformed the way this project manager runs this program.
Are you wondering how this group of 35 reacted the first time this process went from the static paper version to the electronic dashboard? I happened to be witness to this first debut. The transition was seamless, it was simple to follow, and there wasn’t a person in the room that wasn’t impressed. I’ll bet there is a process in your organization that could use a MindManager dashboard! To see the clearer pdf version of this map, go to my website and click on the column titled map name. It will show titles alphabetically, and you can scroll down to “Program Dashboard”.
To see other maps created by this project manager see: Dare to Dream, Then Do It, and DeBono’s Six Thinking Hats.
![[Ask]](http://ideamapping.ideamappingsuccess.com/IdeaMappingBlogs/wp-content/plugins/bookmarkify/ask.png)
![[del.icio.us]](http://ideamapping.ideamappingsuccess.com/IdeaMappingBlogs/wp-content/plugins/bookmarkify/delicious.png)
![[Digg]](http://ideamapping.ideamappingsuccess.com/IdeaMappingBlogs/wp-content/plugins/bookmarkify/digg.png)
![[Facebook]](http://ideamapping.ideamappingsuccess.com/IdeaMappingBlogs/wp-content/plugins/bookmarkify/facebook.png)
![[Google]](http://ideamapping.ideamappingsuccess.com/IdeaMappingBlogs/wp-content/plugins/bookmarkify/google.png)
![[MySpace]](http://ideamapping.ideamappingsuccess.com/IdeaMappingBlogs/wp-content/plugins/bookmarkify/myspace.png)
![[Slashdot]](http://ideamapping.ideamappingsuccess.com/IdeaMappingBlogs/wp-content/plugins/bookmarkify/slashdot.png)
![[Sphinn]](http://ideamapping.ideamappingsuccess.com/IdeaMappingBlogs/wp-content/plugins/bookmarkify/sphinn.png)
![[StumbleUpon]](http://ideamapping.ideamappingsuccess.com/IdeaMappingBlogs/wp-content/plugins/bookmarkify/stumbleupon.png)
![[Technorati]](http://ideamapping.ideamappingsuccess.com/IdeaMappingBlogs/wp-content/plugins/bookmarkify/technorati.png)
![[ThisNext]](http://ideamapping.ideamappingsuccess.com/IdeaMappingBlogs/wp-content/plugins/bookmarkify/thisnext.png)
![[Twitter]](http://ideamapping.ideamappingsuccess.com/IdeaMappingBlogs/wp-content/plugins/bookmarkify/twitter.png)
![[Webride]](http://ideamapping.ideamappingsuccess.com/IdeaMappingBlogs/wp-content/plugins/bookmarkify/webride.png)
![[Email]](http://ideamapping.ideamappingsuccess.com/IdeaMappingBlogs/wp-content/plugins/bookmarkify/email.png)
2 Responses to “Dynamic Dashboard Drastically Improves Productivity – Idea Map #71 Featured in today’s January Mindjet Newsletter”
Leave a reply
Idea Mapping Blog
The purpose of this blog is to share idea mapping examples and related learning from my Idea Mapping, Memory, Speed Reading, and Certification Workshops. This blog is dedicated to my Certified Idea Mapping Instructors, my clients, Mind Mapping and Idea Mapping practitioners around the globe.
Jamie Recommends:
Brent Walker
February 10th, 2008 at 2:30 pm
I’m really interested to see the map that you mentioned in the sentence ( To see the clearer pdf version of this map, go to my website and click on the column titled map name. ) but when I go to your site I’m having some trouble finding it. Could you help me please?
Jamie Nast
February 10th, 2008 at 5:15 pm
Brent,
The map title is Program dashboard, and the direct link is http://ideamappingsuccess.com/Maps/Program%20Dashboard.pdf.
Hope that helps.
Jamie