An Idea Mapping Success Blogs Weblog
Franklin Templeton Library Mid-Year Results Featured in the August Mindjet Newsletter
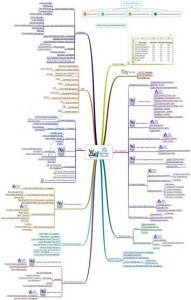
6Aug2008 Filed under: Certified Idea Mapping Instructors, Idea Mapping Example, Mind Mapping Examples, Mind Mapping Software Author: Jamie NastLarisa Brigevich is the Director of the Global Research Library at Franklin Templeton. In April 2008 she completed the 5-day Idea Mapping Certification workshop. Her first contribution to this blog was January 7, 2008 and she has had several since then. I’ll let her explain how she used idea mapping and MindManager to manage this large project. Larisa’s map is quite complex, so you will need to double-click on it to have a better view. If you would like the original MindManager map, send and email to Larisa@IdeaMappingSuccess.com. For those that don’t have MindManager, the full pdf version is available on my website. Thanks Larisa!
“This map is a visual summary of the library team’s 2008 mid-year accomplishments. In the pre-idea mapping past, I’d put this summary in an Excel spreadsheet, ranging between 3 and 5 pages, with information organized by corporate objectives. This time, I’ve created an idea map instead. I enjoyed working on it more than working on a spreadsheet. Using images to substantiate key concepts such as “raising the bar” made the process more fun.
From the business view point, presenting our numerous accomplishments in a visual format on a single page makes it easier for both, the team and senior management to review (and admire our success :-)). In fact, when I showed the map to the team, the first reaction was “we had no idea how much we’d done during this period”. Of course, with a map it is easier to draw connections b/w various activities and add supporting documentations as attachments.
At the top of the map I included corporate priorities, marking them with numbers from one to four. I wanted to attach these numbers or their combinations as images next to various activities/initiatives to link them to corporate priorities.”
This map is featured in today’s Mindjet Monthly Newsletter.
6 Responses to “Franklin Templeton Library Mid-Year Results Featured in the August Mindjet Newsletter”
Leave a reply
Idea Mapping Blog
The purpose of this blog is to share idea mapping examples and related learning from my Idea Mapping, Memory, Speed Reading, and Certification Workshops. This blog is dedicated to my Certified Idea Mapping Instructors, my clients, Mind Mapping and Idea Mapping practitioners around the globe.

![[Ask]](http://ideamapping.ideamappingsuccess.com/IdeaMappingBlogs/wp-content/plugins/bookmarkify/ask.png)
![[del.icio.us]](http://ideamapping.ideamappingsuccess.com/IdeaMappingBlogs/wp-content/plugins/bookmarkify/delicious.png)
![[Digg]](http://ideamapping.ideamappingsuccess.com/IdeaMappingBlogs/wp-content/plugins/bookmarkify/digg.png)
![[Facebook]](http://ideamapping.ideamappingsuccess.com/IdeaMappingBlogs/wp-content/plugins/bookmarkify/facebook.png)
![[Google]](http://ideamapping.ideamappingsuccess.com/IdeaMappingBlogs/wp-content/plugins/bookmarkify/google.png)
![[MySpace]](http://ideamapping.ideamappingsuccess.com/IdeaMappingBlogs/wp-content/plugins/bookmarkify/myspace.png)
![[Slashdot]](http://ideamapping.ideamappingsuccess.com/IdeaMappingBlogs/wp-content/plugins/bookmarkify/slashdot.png)
![[Sphinn]](http://ideamapping.ideamappingsuccess.com/IdeaMappingBlogs/wp-content/plugins/bookmarkify/sphinn.png)
![[StumbleUpon]](http://ideamapping.ideamappingsuccess.com/IdeaMappingBlogs/wp-content/plugins/bookmarkify/stumbleupon.png)
![[Technorati]](http://ideamapping.ideamappingsuccess.com/IdeaMappingBlogs/wp-content/plugins/bookmarkify/technorati.png)
![[ThisNext]](http://ideamapping.ideamappingsuccess.com/IdeaMappingBlogs/wp-content/plugins/bookmarkify/thisnext.png)
![[Twitter]](http://ideamapping.ideamappingsuccess.com/IdeaMappingBlogs/wp-content/plugins/bookmarkify/twitter.png)
![[Webride]](http://ideamapping.ideamappingsuccess.com/IdeaMappingBlogs/wp-content/plugins/bookmarkify/webride.png)
![[Email]](http://ideamapping.ideamappingsuccess.com/IdeaMappingBlogs/wp-content/plugins/bookmarkify/email.png)
Liza Seiner
August 6th, 2008 at 4:34 pm
Wow! Larisa’s map is amazing. The sheer size of the map is inspirational. Really nice job and I’m sure the team appreciates the “reality check” that a map like this gives.
Cristine Goldberg
August 6th, 2008 at 9:37 pm
Larisa’s map is a well done and a very clever way to get people to pay attention to the presentation. How much nicer than the dull ppts that we all are repeatedly subjected to.
Kaye Nightingale
August 7th, 2008 at 11:49 am
What I really like about Larisa’s map is the combination of VISION and DETAIL.
The fact that each branch is a different colour, with images to draw the eye, makes it visually stimulating and appealing. Combine that with the level of detail, including narrative, hyperlinks and a spreadsheet, means that everyone knows exactly what they are looking at.
With every map I now create (having read Idea Mapping) I strive to find the correct balance between VISION (using colour and images) and DETAIL.
Larisa’s map is a really great example of just that.
Glenn Stennes
August 9th, 2008 at 4:20 am
Larisa’s map is a great example of how to take traditional reporting information and turn it into something exciting and stimulating. There is a huge amount of detail here that Larisa has managed to include without it becoming overwhelming.
Learn to think visually - or else - Mind Mapping Software Blog
September 9th, 2008 at 10:36 pm
[…] has started to hit mainstream executives. Bill Miller from Nationwide is a good example of this. Larisa Brigevich, Director for Franklin Templeton, is another. I’m sure there are many others, but I’m […]
Idea Mapping Blog - Top 10 Postings for 2008 | Idea Mapping
January 1st, 2009 at 7:52 pm
[…] – Franklin Templeton Library Mid-Year Results by Larisa […]